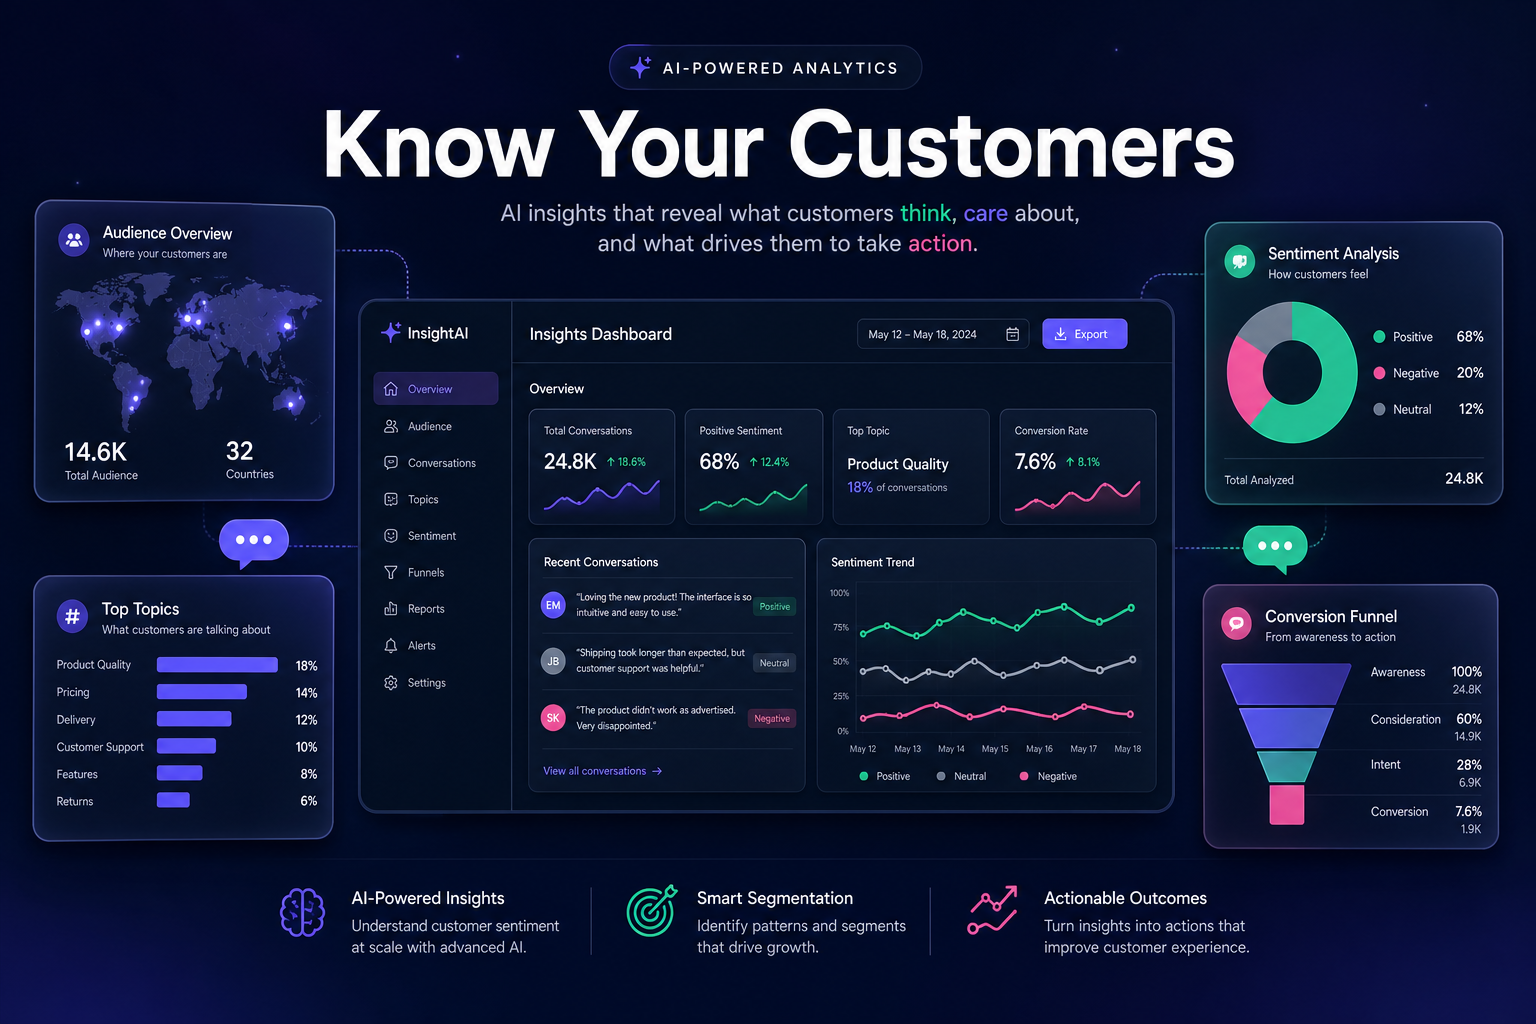
Your Chatbot Has Been Sitting on a Gold Mine
Every conversation your AI chatbot has is a data point. Who is this person? Where are they from? What are they frustrated about? Did they find what they needed — or did they leave empty-handed?
Most businesses set up a chatbot, watch it answer questions, and stop there. They have no idea that their chat widget is quietly collecting the richest customer intelligence they'll ever have access to: real people, asking real questions, in their own words, in real time.
Today, we're changing that. Mujib now ships with a full Marketing Analytics Suite — four interconnected features that turn your chatbot's conversation data into actionable business intelligence. No data science team required. No third-party tools. Everything in one dashboard.
Feature 1: Audience Insights — Who Is Actually Visiting?
Before you can serve your customers well, you need to know who they are. Audience Insights automatically captures the metadata behind every chat session — without asking visitors a single question.
What Gets Tracked
- Geography: Country and city, derived from IP address. See a real-time map of where your customers are concentrated.
- Device & Browser: Mobile vs. desktop vs. tablet. Chrome vs. Safari vs. Firefox. This tells you how to design your chat experience.
- Operating System: iOS, Android, Windows, macOS — gives you the full device picture.
- Language: Browser's preferred language. Discover if you need to expand your multilingual support.
- Referrer URL: Where did the visitor come from? Google search? An email campaign? A specific blog post? This closes the attribution loop between marketing spend and chat engagement.
- Page URL: Which page of your website triggered the chat? Visitors on the pricing page have different intent than those on your help center.
Why This Changes Everything
Most businesses assume they know their customer. Audience Insights often reveals the opposite. One SaaS company using an early version of this feature discovered that 40% of their chat traffic came from Southeast Asia — a region they weren't actively marketing to. That single data point reshaped their expansion strategy.
Similarly, if 70% of your visitors are on mobile but your widget is only optimized for desktop, you're leaving satisfaction on the table. Audience Insights shows you this gap immediately.
Practical use: Check the Audience dashboard every Monday morning. If a new country spikes suddenly, investigate — it could be a viral mention, a translated article, or an affiliate partner driving unexpected traffic.
Feature 2: Conversation Insights — What Are They Talking About?
Knowing who visits is half the story. The other half is understanding what they care about. Conversation Insights uses AI to analyze every chat message and extract three critical signals automatically:
Topics — The Real Agenda
Every conversation gets classified into a primary topic: Pricing, Shipping, Returns, Technical Support, Product Information, and so on. Over time, you see a ranked list of the most frequently discussed topics across all your conversations.
This is your customer's actual agenda — not what your marketing says they care about, but what they're actually asking. If "Shipping delays" is your #1 topic for three weeks straight, that's an operational signal, not just a customer service issue.
Sentiment — How Do They Feel?
Each conversation is scored as positive, neutral, or negative, with a granular score from 0 to 1. The dashboard shows:
- Sentiment distribution: What percentage of conversations are positive, neutral, or negative right now?
- Sentiment trend over time: Is customer sentiment improving or declining? Did a product update or shipping issue shift the mood?
This is the closest thing to a real-time customer satisfaction gauge that exists. Most businesses only measure CSAT through surveys — which capture maybe 5% of customers. Sentiment analysis covers 100% of conversations, automatically.
Keywords — The Exact Words They Use
Beyond topics and sentiment, the system extracts the specific words customers use most. These keywords are gold for:
- SEO: If customers keep asking about "same-day delivery" but that phrase doesn't appear anywhere on your site, you're missing organic traffic.
- Ad copy: Use the exact language customers already use to describe your product — it outperforms internally-crafted marketing language every time.
- Knowledge base gaps: If "refund policy" appears 200 times as a keyword, your KB needs a clear refund article.
The compounding effect: After 30 days of data, your Insights dashboard becomes a strategic planning tool. You'll know your customers' pain points, satisfaction levels, and vocabulary better than most market research reports — and it updates itself daily.
Feature 3: Conversion Tracking — Are Conversations Turning Into Results?
Traffic is vanity. Conversations are interesting. Conversions are what matter.
Conversion Tracking lets you define exactly what "success" means for your chatbot, then measure how often you achieve it. This is the bridge between customer support and business outcomes.
How to Define a Conversion Goal
In Mujib's dashboard, navigate to Projects → Your Project → Conversions → Goals. Create a goal with:
- Name: "Demo Booked", "Purchase Completed", "Email Captured", "Support Ticket Avoided"
- Type: Custom, Lead, Sale, or Support Deflection
- Description: What action represents this conversion in your context
You can create multiple goals per project — most businesses track 3-5 meaningful outcomes simultaneously.
Triggering a Conversion from Your Website
Once Mujib's widget is embedded on your site, a single line of JavaScript fires a conversion event:
// When user clicks "Book Demo" button after chatting
window.mugibTrackConversion("Demo Booked", {
  plan: "Business",
  source: "pricing_page"
});
This ties the conversion to the active chat session, capturing the full journey: which page they were on, what topics they discussed, their sentiment during the chat — all linked to the final action they took.
What You See in the Dashboard
- Conversion rate by goal: Of all sessions that engaged with your chatbot, what percentage converted?
- Conversions over time: Daily bar chart to spot trends and the impact of campaigns or changes.
- Session-level data: Which specific sessions led to conversions — cross-reference with their topics and sentiment to understand what works.
The real value: When you can show that chatbot sessions have a 12% conversion rate on the pricing page vs. 3% on the homepage, you can make a data-driven decision to invest in a richer chatbot experience on the highest-intent pages.
Feature 4: Exportable Reports — Your Data, Your Way
Data locked in a dashboard is useful. Data you can share, analyze, and present is powerful.
Mujib's Reports feature gives you two output formats:
Summary Report (JSON)
A structured snapshot of your key metrics for any date range: total sessions, active users, top topics, sentiment breakdown, conversion rates by goal, token usage, and visitor demographics. Ideal for programmatic consumption — pipe it into your BI tool, Notion database, or weekly automated email.
Full CSV Export
A flat CSV file with row-level data: every session, every visitor record, every insight classification, and every conversion event. This is the raw material for custom analysis in Excel, Google Sheets, or Python.
Use cases our customers told us they needed this for:
- Monthly board reports with chatbot performance metrics
- CRM enrichment — importing chat sentiment data alongside customer records
- A/B testing analysis — comparing conversion rates before and after knowledge base updates
- Regional performance breakdowns for multi-location businesses
Access exports from Projects → Reports → Export CSV and choose your date range. The export includes all four analytics categories in a single, structured file.
How the Four Features Work Together
These aren't four separate tools. They're one cohesive intelligence loop:
- Audience Insights tells you who is arriving and from where.
- Conversation Insights tells you what they care about and how they feel.
- Conversion Tracking tells you whether the interaction drove business outcomes.
- Reports package all three into shareable evidence.
Together, they answer the question every growth-focused business asks: "Is our chatbot actually working for us — and what does our customer really want?"
A Real Scenario: From Data to Decision in 48 Hours
Imagine you run an online education platform. Here's how a typical week of analytics might inform a major decision:
- Monday: Audience Insights shows a traffic spike from Saudi Arabia — 3x normal volume.
- Tuesday: Conversation Insights reveals the top topic for that traffic is "Arabic course availability" with 78% negative sentiment (the courses don't exist).
- Wednesday: You check Conversion Tracking — Arabic-speaking sessions have near-zero conversion rate. Non-Arabic sessions convert at 9%.
- Thursday: You export the CSV, filter by country = Saudi Arabia, and share the findings with your content team. The data is unambiguous: there's a market you're not serving.
- Friday: Leadership greenlight an Arabic course pilot — a decision that would normally take months of market research happened in one week, driven entirely by chatbot data.
Getting Started
All four features are available now on all Mujib plans. No configuration required — data collection begins the moment your chatbot goes live.
- Log in to your Mujib dashboard
- Open any project and look for the new sidebar items: Audience, Insights, and Conversions
- If you want conversion tracking, create your first goal under Conversions → Goals and add the one-line JS snippet to your site
- Come back in 7 days — your data will already be telling a story
The bottom line: Your chatbot isn't just a support tool anymore. With Marketing Analytics, it's your most active market research instrument — running 24/7, speaking to real customers, in their own words, right now.
بوتك كان يجلس فوق منجم ذهب
كل محادثة يجريها بوتك الذكي هي نقطة بيانات. مين هذا الشخص؟ من وين جاي؟ شنو اللي يضايقه؟ لقى اللي يبي — ولا راح وهو فاضي؟
أغلب الشركات تنصب بوت ذكاء، تشوفه يجاوب الأسئلة، وتوقف عند هذا الحد. ما يعرفون إن ويدجت الدردشة تجمع بصمت أغنى استخبارات زبائن يمكن يوصلون إليها: أشخاص حقيقيين، بأسئلة حقيقية، بكلماتهم الخاصة، بالوقت الفعلي.
اليوم، نغير هذا. مجيب الآن يأتي مع مجموعة التحليلات التسويقية الكاملة — أربع ميزات مترابطة تحوّل بيانات محادثات بوتك إلى استخبارات أعمال قابلة للتنفيذ. بدون فريق بيانات. بدون أدوات خارجية. كل شي في لوحة تحكم واحدة.
الميزة 1: تحليل الجمهور — مين يزورك فعلاً؟
قبل ما تخدم زبائنك بشكل صحيح، تحتاج تعرف مين هم. تحليل الجمهور يلتقط تلقائياً البيانات الوصفية وراء كل جلسة دردشة — بدون ما تسأل الزوار سؤالاً واحداً.
شنو يتتبع
- الجغرافيا: الدولة والمدينة، مستخرجة من عنوان IP. شوف خريطة فعلية لتركز زبائنك.
- الجهاز والمتصفح: جوال مقابل سطح المكتب مقابل التابلت. كروم مقابل سفاري مقابل فايرفوكس. هذا يوريك كيف تصمم تجربة الدردشة.
- نظام التشغيل: iOS، Android، Windows، macOS — الصورة الكاملة للجهاز.
- اللغة: اللغة المفضلة للمتصفح. اكتشف إذا كنت تحتاج توسع دعمك متعدد اللغات.
- رابط المصدر: من وين جاء الزائر؟ بحث جوجل؟ حملة بريد إلكتروني؟ مقالة معينة؟ هذا يغلق دائرة الإسناد بين الإنفاق التسويقي وتفاعل الدردشة.
- رابط الصفحة: أي صفحة من موقعك أطلقت الدردشة؟ الزوار على صفحة التسعير لهم نية مختلفة عن اللي على مركز المساعدة.
ليش هذا يغير كل شي
أغلب الشركات تفترض إنها تعرف زبائنها. تحليل الجمهور كثيراً ما يكشف العكس. شركة SaaS استخدمت نسخة مبكرة من هذه الميزة اكتشفت إن 40% من حركة دردشتها جاءت من جنوب شرق آسيا — منطقة ما كانت تسوّق إليها بنشاط. هذه النقطة الواحدة أعادت تشكيل استراتيجية توسعها.
بالمثل، إذا 70% من زوارك على الجوال لكن ويدجتك معسوط بس للكمبيوتر، أنت تخسر رضا كبير. تحليل الجمهور يوريك هذه الفجوة فوراً.
استخدام عملي: راجع لوحة الجمهور كل صباح اثنين. إذا دولة جديدة ارتفعت فجأة، حقق — يمكن يكون ذكر فيروسي، مقالة مترجمة، أو شريك تابع يجيب حركة غير متوقعة.
الميزة 2: تحليل المحادثات — شنو يتكلمون عنه؟
معرفة مين يزور هو نص القصة. النص الثاني هو فهم شنو يهتمون به. تحليل المحادثات يستخدم الذكاء الاصطناعي لتحليل كل رسالة دردشة واستخراج ثلاث إشارات حرجة تلقائياً:
المواضيع — الأجندة الحقيقية
كل محادثة تُصنَّف تحت موضوع رئيسي: التسعير، الشحن، المرتجعات، الدعم التقني، معلومات المنتج، وغيرها. مع الوقت، تشوف قائمة مرتبة للمواضيع الأكثر نقاشاً عبر كل محادثاتك.
هذي أجندة زبائنك الحقيقية — مو ما يقوله تسويقك إنهم يهتمون به، لكن ما يسألون عنه فعلاً. إذا "تأخر الشحن" هو موضوعك الأول لثلاثة أسابيع متتالية، هذي إشارة تشغيلية، مو مجرد مشكلة خدمة عملاء.
المشاعر — كيف يحسون؟
كل محادثة تُصنَّف كإيجابية أو محايدة أو سلبية، مع نقاط دقيقة من 0 إلى 1. اللوحة تعرض:
- توزيع المشاعر: كم نسبة المحادثات الإيجابية والمحايدة والسلبية الآن؟
- اتجاه المشاعر مع الوقت: هل رضا العملاء يتحسن أو يتراجع؟ هل تحديث منتج أو مشكلة شحن غيّر المزاج؟
هذا أقرب شي لمقياس رضا العملاء بالوقت الفعلي موجود. أغلب الشركات تقيس CSAT عبر استطلاعات — تلتقط ربما 5% من الزبائن. تحليل المشاعر يغطي 100% من المحادثات، تلقائياً.
الكلمات المفتاحية — الكلمات اللي يستخدمونها بالضبط
بعيداً عن المواضيع والمشاعر، النظام يستخرج الكلمات المحددة اللي يستخدمها الزبائن أكثر. هذي الكلمات ذهب لـ:
- السيو: إذا الزبائن يسألون باستمرار عن "توصيل نفس اليوم" لكن هذه العبارة ما تظهر في موقعك، أنت تخسر حركة عضوية.
- نص الإعلانات: استخدم اللغة الدقيقة اللي يستخدمها الزبائن لوصف منتجك — تتفوق على لغة التسويق المصنوعة داخلياً في كل مرة.
- فجوات قاعدة المعرفة: إذا "سياسة الاسترداد" ظهرت 200 مرة ككلمة مفتاحية، قاعدة معرفتك تحتاج مقال واضح عن الاسترداد.
الأثر المتراكم: بعد 30 يوم من البيانات، لوحة Insights تصير أداة تخطيط استراتيجي. راح تعرف نقاط ألم زبائنك، مستويات رضاهم، ومفرداتهم أفضل من أغلب تقارير أبحاث السوق — وتحدث نفسها يومياً.
الميزة 3: تتبع التحويل — هل المحادثات تتحول لنتائج؟
الحركة غرور. المحادثات مثيرة للاهتمام. التحويلات هي اللي تهم.
تتبع التحويل يخليك تحدد بالضبط شنو يعني "النجاح" لبوتك، ثم تقيس كم مرة تحققه. هذا هو الجسر بين خدمة العملاء ونتائج الأعمال.
كيف تعرف هدف تحويل
في لوحة مجيب، روح لـ المشاريع ← مشروعك ← التحويلات ← الأهداف. أنشئ هدفاً بـ:
- الاسم: "حجز ديمو"، "إتمام شراء"، "التقاط بريد إلكتروني"، "تجنب تذكرة دعم"
- النوع: مخصص، عميل محتمل، بيعة، أو تحويل دعم
- الوصف: أي إجراء يمثل هذا التحويل في سياقك
تقدر تنشئ أهدافاً متعددة لكل مشروع — أغلب الشركات تتبع 3-5 نتائج مهمة في نفس الوقت.
تشغيل تحويل من موقعك
بعد تضمين ويدجت مجيب في موقعك، سطر واحد من JavaScript يطلق حدث تحويل:
// لما المستخدم يضغط زر "احجز ديمو" بعد الدردشة
window.mugibTrackConversion("حجز ديمو", {
  الباقة: "Business",
  المصدر: "صفحة_التسعير"
});
هذا يربط التحويل بجلسة الدردشة النشطة، ملتقطاً الرحلة الكاملة: أي صفحة كانوا عليها، المواضيع اللي ناقشوها، مشاعرهم خلال الدردشة — كل شي مرتبط بالإجراء النهائي.
شنو تشوف في اللوحة
- معدل التحويل حسب الهدف: من كل الجلسات اللي تفاعلت مع بوتك، كم نسبة تحولت؟
- التحويلات مع الوقت: مخطط شريطي يومي لاكتشاف الاتجاهات وأثر الحملات أو التغييرات.
- البيانات على مستوى الجلسة: أي جلسات تحديداً أدت للتحويل — قارنها مع مواضيعها ومشاعرها لفهم ما ينجح.
القيمة الحقيقية: لما تقدر تثبت إن جلسات البوت لها معدل تحويل 12% في صفحة التسعير مقابل 3% في الصفحة الرئيسية، تقدر تاخذ قرار مبني على البيانات للاستثمار في تجربة بوت أغنى في الصفحات ذات النية العالية.
الميزة 4: التقارير القابلة للتصدير — بياناتك، بطريقتك
البيانات المحبوسة في لوحة تحكم مفيدة. البيانات اللي تقدر تشاركها وتحللها وتقدمها قوية.
ميزة التقارير في مجيب تعطيك صيغتين للإخراج:
تقرير الملخص (JSON)
لقطة منظمة لمقاييسك الرئيسية لأي نطاق زمني: إجمالي الجلسات، المستخدمين النشطين، أبرز المواضيع، تفصيل المشاعر، معدلات التحويل حسب الهدف، استخدام التوكن، وبيانات الزوار الديموغرافية. مثالي للاستهلاك البرمجي — وجّهه لأداة BI أو قاعدة بيانات Notion أو بريد إلكتروني أسبوعي تلقائي.
تصدير CSV كامل
ملف CSV مسطح ببيانات على مستوى الصف: كل جلسة، كل سجل زائر، كل تصنيف insights، وكل حدث تحويل. هذا المادة الخام للتحليل المخصص في Excel أو Google Sheets أو Python.
حالات استخدام أخبرنا زبائننا إنهم يحتاجونها:
- تقارير مجلس الإدارة الشهرية بمقاييس أداء البوت
- إثراء CRM — استيراد بيانات مشاعر الدردشة جنب سجلات العملاء
- تحليل A/B testing — مقارنة معدلات التحويل قبل وبعد تحديثات قاعدة المعرفة
- تفصيلات الأداء الإقليمي للشركات متعددة المواقع
وصّل التصديرات من المشاريع ← التقارير ← تصدير CSV واختر نطاقك الزمني. التصدير يشمل جميع فئات التحليلات الأربع في ملف واحد منظم.
كيف الميزات الأربع تعمل معاً
هذي مو أربع أدوات منفصلة. هي حلقة استخبارات متماسكة واحدة:
- تحليل الجمهور يخبرك مين يصل ومن وين.
- تحليل المحادثات يخبرك شنو يهمهم وكيف يحسون.
- تتبع التحويل يخبرك هل التفاعل أنتج نتائج أعمال.
- التقارير تغلّف الثلاثة في أدلة قابلة للمشاركة.
مع بعض، يجيبون إجابة على السؤال اللي تسأله كل شركة تركز على النمو: "هل بوتنا يشتغل فعلاً — وشنو يريد زبائننا حقاً؟"
سيناريو حقيقي: من البيانات للقرار في 48 ساعة
تخيّل إنك تدير منصة تعليم أونلاين. كيف أسبوع من التحليلات ممكن يشكّل قرار كبير:
- الاثنين: تحليل الجمهور يكشف ارتفاعاً في الحركة من السعودية — 3 أضعاف الحجم المعتاد.
- الثلاثاء: تحليل المحادثات يكشف إن الموضوع الأعلى لتلك الحركة هو "توفر الدورات العربية" بمشاعر سلبية 78% (الدورات غير موجودة).
- الأربعاء: تراجع تتبع التحويل — الجلسات العربية لها معدل تحويل قريب من صفر. الجلسات غير العربية تتحول بمعدل 9%.
- الخميس: تصدّر CSV، فلتر حسب الدولة = السعودية، وشارك النتائج مع فريق المحتوى. البيانات لا لبس فيها: في سوق لا تخدمه.
- الجمعة: القيادة توافق على تجربة دورة عربية — قرار كان يأخذ عادةً أشهراً من أبحاث السوق حصل في أسبوع واحد، مدفوعاً كلياً ببيانات البوت.
كيف تبدأ
الميزات الأربع متاحة الآن في جميع باقات مجيب. لا حاجة لإعداد — جمع البيانات يبدأ فوراً بعد ما بوتك يشتغل مباشرةً.
- سجّل دخولك على لوحة مجيب
- افتح أي مشروع وابحث عن العناصر الجديدة في الشريط الجانبي: الجمهور، Insights، والتحويلات
- إذا تبي تتبع التحويل، أنشئ أول هدف تحت التحويلات ← الأهداف وأضف مقطع JS لموقعك
- ارجع بعد 7 أيام — بياناتك ستكون تحكي قصة بالفعل
الخلاصة: بوتك مو مجرد أداة دعم بعد الآن. مع التحليلات التسويقية، هو أكثر أدوات أبحاث السوق نشاطاً عندك — يشتغل 24/7، يتكلم مع زبائن حقيقيين، بكلماتهم الخاصة، الآن.